Artificial-intelligence weather and climate systems increasingly improve forecast speed and skill, but adaptation value depends on whether forecast information is reliable near decision thresholds, interpreted through vulnerability and institutional capacity, and robust to futures that cannot be assigned precise probabilities. This study develops a decision-calibrated climate-AI (DCCA) framework and demonstrates its decision layer for Bangladesh using published secondary indicators from the World Bank Climate Change Knowledge Portal, the 2024 Bangladesh Climate Risk Country Profile, and ND-GAIN. Four mid-century SSP3-7.0 indicators are examined: heat-index days above 35 C, tropical nights above 26 C, largest five-day precipitation, and compression of the historical 100-year one-day rainfall return period. Hazard escalation is separated from a transparent context-adjusted screening score. Robustness is evaluated across 81 equally weighted stress-test combinations per hazard spanning climate quantiles, vulnerability, readiness, and normalization-benchmark uncertainty. Among the selected indicators, heat-index days and tropical nights have median screening scores of 46.7 and 46.6 and cross the main threshold in 63.0% of combinations; both rainfall indicators cross it in 33.3%. These fractions are robustness diagnostics, not probabilities. The results show why predictive skill, probabilistic calibration, decision calibration, and adaptation robustness should be reported as distinct quantities. The empirical demonstration does not train an AI model; instead, it isolates the auditable decision layer that operational climate-AI systems should place around forecast outputs before informing adaptation investment.
Research ArticleClimate Adaptation and Artificial IntelligenceIn progress
Decision-Calibrated Climate AI: Translating Hazard Information into Robust Adaptation Priorities under Deep Uncertainty - A Bangladesh Demonstration
Correspondence: safrin2468@gmail.com
Abstract
Keywords climate AIdecision supportforecast calibrationdeep uncertaintyrobust adaptationBangladeshclimate risk
1. Introduction
Climate adaptation is becoming increasingly information-intensive. Government agencies, development partners, utilities, insurers, municipalities, and humanitarian organizations now have access to gridded climate projections, reanalysis products, ensemble summaries, impact-based warning systems, and rapidly advancing artificial-intelligence weather models. Systems such as Pangu-Weather, GraphCast, GenCast, and NowcastNet demonstrate that machine learning can achieve highly competitive performance in medium-range global forecasting, probabilistic ensemble prediction, and precipitation nowcasting (Bi et al., 2023; Lam et al., 2023; Price et al., 2025; Zhang et al., 2023). This technical progress is consequential, but it can also create an implicit policy assumption: better prediction should automatically generate better adaptation decisions. That assumption is incomplete because adaptation is not a direct extension of forecast accuracy.
A forecast answers a question about a future physical state; an adaptation decision must additionally address who or what is exposed, how vulnerable the affected system is, what institutional capacity exists to act, what error is tolerable, which threshold should trigger action, and how the decision performs when future conditions depart from a central estimate. Climate risk is produced through the interaction of hazard, exposure, and vulnerability rather than hazard alone (IPCC, 2022). A technically skilful forecast can therefore have low decision value if it is poorly calibrated for the event threshold that matters to a user, if the exposed population is not represented, or if the recommended action is fragile to plausible socioeconomic or institutional change. Conversely, an imperfect forecast can still support useful low-regret action when the consequences of delay are high and the intervention remains defensible across a broad range of futures.
The distinction has become more important as climate AI moves from research benchmarks toward operational use. Recent governance research finds that AI applications in climate resilience are concentrated on risk assessment, particularly hazard and exposure estimation, while comparatively less attention is given to vulnerability, prioritization, implementation, and the institutional conditions that determine whether an output can be acted upon (Mehryar et al., 2024). Work on AI-supported impact-based weather warnings similarly emphasizes that usable information emerges through organizational processes and stakeholder interpretation, not from algorithms in isolation (Neset et al., 2024). Probabilistic forecasting adds another requirement: forecast distributions must be reliable, not merely sharp or accurate on average. Proper scoring rules and reliability diagnostics are therefore central when a forecast probability can trigger public expenditure or emergency action (Gneiting & Raftery, 2007).
Climate adaptation also operates under deep uncertainty. Decision-makers may not know, or may not agree on, the probability distribution of future emissions, regional climate response, population growth, land-use change, institutional capacity, technology, or social preferences. Decision making under deep uncertainty (DMDU) responds by asking whether a policy remains acceptable across many plausible futures rather than optimizing against a single expected future (Kalra et al., 2014; Marchau et al., 2019). Recent work has reinforced the importance of testing the robustness of the ultimate adaptation decision, not only uncertainty in the climate-risk estimate itself (Babich Morrow et al., 2025). This logic is directly relevant to climate AI: a more skilful hazard model does not guarantee a robust adaptation ranking if the decision changes sharply with vulnerability assumptions, readiness, normalization choices, or action thresholds.
Bangladesh provides a policy-relevant setting in which to demonstrate this distinction. The 2024 World Bank Climate Risk Country Profile estimates that more than 90 million people, approximately 56% of the population, live in high climate-exposure areas affected by multiple hazards (World Bank, 2024). The same profile projects substantial increases in high heat-index days and tropical nights by mid-century under SSP3-7.0, while heavy-rainfall indicators display wide ensemble ranges. Independent CMIP6 studies also report strong warming and spatially heterogeneous precipitation changes across Bangladesh, reinforcing the importance of local interpretation rather than reliance on a single national average (Jihan et al., 2025; Kamruzzaman et al., 2023).Heat is already a development concern: a World Bank analysis of more than 16,000 people links rising heat in Bangladesh to health burdens and productivity losses (Mahmud et al., 2024).The methodological problem is therefore not a lack of climate information. It is the absence of a clearly auditable bridge between forecast information and adaptation action. Existing AI-weather studies primarily evaluate predictive skill; adaptation decision-analysis studies examine uncertainty, robustness, pathways, or multi-criteria priorities; and climate-resilience governance studies emphasize context and implementation. These literatures are complementary but are often operationalized separately. This paper develops a decision-calibrated climate-AI (DCCA) framework that explicitly separates four quantities that are frequently conflated: predictive skill, probabilistic forecast calibration, decision calibration, and decision robustness. The empirical demonstration uses published ensemble climate indicators rather than claiming to train or validate a new AI model. This deliberate scope isolates the decision layer that could be attached to AI-generated, numerical-model, or conventional climate-service outputs.
The paper addresses four research questions. RQ1 asks how the selected Bangladesh heat and rainfall indicators change from the historical reference period to mid-century under SSP3-7.0. RQ2 asks how the interpretation changes when hazard information is translated into a transparent vulnerability- and readiness-adjusted screening score while population exposure is reported separately to avoid double counting. RQ3 asks which hazard-linked priorities remain above decision thresholds across plausible climate, vulnerability, readiness, and normalization assumptions. RQ4 asks what minimum governance and reporting requirements should accompany climate-AI outputs used for adaptation decisions. The contribution is not a claim that one national index can determine investment. Rather, it is a reproducible demonstration of how to make the forecast-to-decision translation explicit, contestable, and stress-tested before scarce adaptation resources are allocated.
2. Literature Review and Conceptual Foundation
2.1 Climate AI and the forecast-to-decision gap
Recent machine learning weather models have revolutionized the art of weather forecasting. Pangu-Weather was a proof-of-concept, 3D neural networks for accurate medium-range global weather forecasting (Bi et al., 2023). On a significant proportion of tested targets, GraphCast's graph-based learning was able to outperform a top-of-the-line deterministic numerical system (Lam et al., 2023). GenCast furthered this work with a probabilistic implementation of global ensemble forecasting, where the model explicitly represents uncertainty and includes the properties of the model calibration as well as the model skill (Price et al., 2025).NowcastNet is designed for the other horizon, where it is able to learn high-resolution precipitation dynamics for nowcasting of precipitation extremes for a short time. (Zhang et al., 2023)Out-of-sample verification and similar evaluation (Rasp et al., 2020)have also been improved by benchmarking initiatives.
None of these advances eliminate the forecast-to-decision gap. Adaptation users seldom take action on the mean error on the global level. A health agency will be interested in the likelihood of heat stress exceeding a threshold; a drainage authority will be interested in tail precipitation at a particular return period; a labour ministry will be interested in the likelihood of a number of consecutive days on which outdoor work is unsafe. The forecast property is then contingent upon a decision. While high spatial resolution can enhance local relevance, it can also lead to false precision if uncertainty and/or disagreement in models and/or limited observations are not accounted for. Other factors in the decision problem are the effects of false alarms, the miss of events, budget constraints, implementation lead times, distributional effects and institutional legitimacy.
2.2 Predictive skill, probabilistic calibration, decision calibration, and robustness
One major conceptual adjustment is to split up four evaluation questions. Predictive Skill is asking if a model is more accurate at forecasting than the benchmark. Probabilistic calibration has to do with whether or not the probabilities assigned to the forecasts are statistically sound, that is, whether the events with the probability of n should happen with that frequency in repeated applications. Decision calibration: Are the forecast distribution, threshold, loss structure, exposure, vulnerability and implementation context aligned with the actual decision? Next, robustness queries about the defensibility of the action chosen in the face of variability in the inputs and normative decisions. These quantities are related, however they can not be replaced. A forecast might be skilful yet have a poor calibration, it could have a good calibration and yet, be irrelevant to the decision making threshold, or it could be decision relevant under a given assumed future but weak or fragile under deep uncertainty.
Table 1. Distinct evaluation layers in decision-calibrated climate AI
| Layer | Primary question | Typical evidence | Failure if omitted |
|---|---|---|---|
| Predictive skill | Does the forecast outperform an appropriate benchmark? | MAE/RMSE, anomaly correlation, event skill, benchmark comparison | A technically weak model may be treated as authoritative. |
| Probabilistic calibration | Do stated probabilities match observed frequencies? | Brier score, reliability curve, calibration slope/intercept, proper scores | Overconfidence or underconfidence distorts trigger decisions. |
| Decision calibration | Is forecast information aligned with thresholds, consequences, vulnerability, capacity, and feasible actions? | Threshold-specific validation, loss matrix, context variables, stakeholder or policy thresholds | Accurate forecasts can still produce poor or inequitable choices. |
| Decision robustness | Does the preferred action remain acceptable across plausible futures and assumptions? | Scenario ensemble, sensitivity analysis, regret, robustness fraction, adaptive pathways | A point-estimate recommendation may collapse when assumptions change. |
Note. The paper uses all four layers conceptually, but the Bangladesh empirical demonstration directly evaluates the decision-calibration and robustness layers because raw probabilistic AI forecasts are not used.
In the probabilistic prediction world, forecasting calibration is a well known fact. The good rules of scoring reward sharp distributions, and ones that are statistically compatible with observations (Gneiting & Raftery, 2007). The calibration should be analysed at spatial scale, lead time, season and event threshold at which the operational climate AI is relevant to the user. If the local extreme is consistently over or under predicted, then a global reliability result is inadequate. Decision calibration goes beyond forecast verification. It clearly states that the threshold can be normative, sector-specific and vulnerable or implementation capacity dependent. This extension is especially relevant for public adaptation in view of the asymmetric distribution of costs of forecast errors to society.
2.3 Adaptation under deep uncertainty
In situations where analysts are not reasonably able to assign only one probability distribution to significant future conditions, the DMDU approach was developed. Instead of finding a policy that maximises expected performance in one forecast, DMDU approaches look for policies that perform well in the presence of many plausible forecasts and find out under which conditions a policy fails (Marchau et al., 2019).This change in approach is taken up in various ways, such as robust decision making, minimax regret, scenario discovery, and dynamic adaptive policy pathways (Haasnoot et al., 2013; Kwakkel et al., 2016; Lempert & Groves, 2010). In response, the IPCC has been turning more to DMDU concepts, as climate risk management needs to be flexible to accommodate high impact low likelihood events, changing social norms and uncertainty over probabilities and values (Lempert et al., 2024).
DMDU redefines the interpretation of forecast improvements for climate-AI applications. When a new model reduces the uncertainty, but the adaptation decision is still very much dependent on cost, institutional readiness or the decision threshold, the policy problem is not yet solved. On the other hand, a decision may be strong even if the range of climate uncertainty is large, provided a "low- regret" action is acceptable over the range of uncertainty. (Babich Morrow et al., 2025) explicitly illustrate that uncertainty around the decision attributes is as important as uncertainty around the climate risk. The present paper is a follow-on to the above and aims at supplementing it with a focus on the translation of climate/climate-AI information into an auditable screening signal prior to a full option-level appraisal.
2.4 Vulnerability, readiness, and the Bangladesh decision context
Magnitude of hazard is an incomplete basis for prioritization. ND-GAIN provides a summary of country level vulnerability and readiness. Vulnerability includes exposure, sensitivity, and adaptive-capacity dimensions and readiness includes economic, governance, and social dimensions that influence the capacity to translate investments into adaptation (Notre Dame Global Adaptation Initiative, n.d.). Bangladesh has an ND-GAIN score of 37.0, vulnerability level of 0.544 and readiness level of 0.284 and ranked 159th. These values represent a high-need, low-readiness environment and technically attractive interventions may still have implementation issues.
An important measurement issue ensues. Conceptually, some information is duplicated in the exposure-related dimensions of vulnerability, which are already accounted for in ND-GAIN vulnerability, so the exposure-related information cannot be meaningfully averaged with ND-GAIN vulnerability. The DCCA demonstration thus considers the World Bank estimate that 56% of the population is in high climate-exposure areas as an additional descriptive exposure signal and only ND-GAIN vulnerability and readiness in the numerical context factor. This design does not mean that exposure is not a critical issue, it does not mean that concepts of heterogeneous exposure are not important, nor does it mean that they can be combined without a defensible measurement model. These national proxies should be substituted with geocoded population exposure and locally-measured vulnerability in a subnational implementation.
2.5 Integrated DCCA framework
The proposed framework is summarized in figure 1. The first layer can be made up of observations, reanalysis, numerical forecasts, forecast distributions from AI, etc. The second layer assesses the predictive ability and in the case of probabilistic products, statistical calibration. The third layer is for decision calibration, which connects forecast information with thresholds and consequences. The fourth layer introduces insecurities, preparation and transparency of exposure reporting. The fifth layer includes stress-testing the uncertainty of climate change and decision variables. Robust actions, conditional pathways and triggers should only be presented after these gates. Thus, AI is considered as a one potential hazard-information engine instead of an independent decision-maker.
3. Materials and Methods
3.1 Research design and scope
The approach in the study is secondary quantitative climate-risk and decision-analytic. It doesn't build a new climate forecast model, a numerical weather model or a machine-learning model. It rather codifies and exemplifies a decision layer that is transparent and is able to take hazard information from traditional climate services or AI-based services. The scope is kept deliberately limited: Only claims that can be backed up with published national indicators and transparent transformations may be made.
The hazard-context indicator in Bangladesh is not a household, weather station or grid cell, but an analytical unit. Four indicators were chosen: the 2024 World Bank profile contains historical or reference values for these indicators, as well as the mid-century SSP3-7.0 estimates, and ensemble uncertainty ranges that can be converted to decision-relevant heat and heavy-rainfall indicators. The selected indicators should not be seen as a full national climate-risk The results provide methodological demonstration and screening interpretation (not a comprehensive national investment ranking) because cyclones, sea-level rise, riverine flood, drought, salinity and compound hazard are not included in the comparison performed in this empirical study.
3.2 Data sources and provenance
Heat indicators are the number of days with heat index temperature greater than 35 C per year and the number of tropical nights (days with minimum temperature > 26 C) per year. The rainfall indicators include the average largest 5 day cumulative precipitation and future return period of the historical 100 year one day rainfall event. Historical/reference conditions are 1995-2014 and mid-century projections are 2040-2059 for SSP3-7.0, aligned with the country profile.
The hazard escalation index for heat counts and 5 day precipitation are based on the comparison of the mid-century median and the historical/reference value. Escalation for the rainfall return-period indicator is based on the change in the frequency of the event: the historical 100-year event has a frequency of 1/100 per year, and the projected frequency is 1/T per year.
Table 2. Secondary data sources and analytical role
| Source | Variables used | Resolution / period | Role in analysis |
|---|---|---|---|
| World Bank CCKP - CMIP6 0.25-degree | Projected temperature and precipitation indicators; ensemble percentiles; SSP information | Global 0.25-degree; 1950-2100; 20-year climatologies; historical reference 1995-2014 | Climate-data provenance and scenario framework |
| World Bank Climate Risk Country Profile: Bangladesh (2024) | High heat-index days; tropical nights; largest 5-day precipitation; future return period of historical 100-year rainfall; population exposure | Bangladesh; historical/reference values and 2040-2059 SSP3-7.0 projections | Empirical hazard inputs and national exposure context |
| ND-GAIN Country Index: Bangladesh | Vulnerability = 0.544; readiness = 0.284; score = 37.0; rank = 159 | Country-level index; values retrieved September 1, 2026 | Context adjustment and stress-test center point |
| World Bank CCKP data registry on AWS | Dataset collections, coverage, license, access paths | Global climate-data registry | Reproducibility and provenance |
Note. The study uses public aggregate secondary data. No raw observations, household records, or synthetic cases are presented as empirical observations.
3.3 Hazard indicators and historical-to-future escalation
Heat indicators are the number of days with heat index temperature greater than 35 C per year and the number of tropical nights (days with minimum temperature > 26 C) per year. The rainfall indicators include the average largest 5 day cumulative precipitation and future return period of the historical 100 year one day rainfall event. Historical/reference conditions are 1995-2014 and mid-century projections are 2040-2059 for SSP3-7.0, aligned with the country profile.
The hazard escalation index for heat counts and 5 day precipitation are based on the comparison of the mid-century median and the historical/reference value. Escalation for the rainfall return-period indicator is based on the change in the frequency of the event: the historical 100-year event has a frequency of 1/100 per year, and the projected frequency is 1/T per year.
Escalation_i = 100 x (Future median_i / Historical_i)
Escalation_return = 100 x (100 / Future return period)
So, a 100 escalation value means there is no change from the reference condition and a value greater than 100 means there is a higher burden or more frequently occurring. This index does not, in itself, define adaptation priority and is descriptive.
3.4 Context-adjusted screening score
The second transformation tool is a decision-screening score that is given on a 0 to 100 scale. It is not a risk of loss, causal effects, actuarial risk measures, or a benefit-cost ratio. To make the normative actions which are being undertaken between the hazard information and decision threshold visible. The score is made up of two parts: a hazard specific normalized burden H and a national context factor C.
The context factor includes a vulnerability V (ND-GAIN) and a readiness penalty (1-R). Arithmetic is not used to include population exposure because exposure related dimensions are already included in ND-GAIN vulnerability. The high-exposure population value of 56% is not collapsed into the population value in the results and policy interpretation.
C = [ V + (1 - R) ] / 2
At the reported Bangladesh values, C = [0.544 + (1 - 0.284)] / 2 = 0.630. The stress test perturbs vulnerability and readiness by +/-0.05, producing V in {0.494, 0.544, 0.594} and R in {0.234, 0.284, 0.334}. These are sensitivity values, not projections of socioeconomic conditions.
Explicit scaling anchors are used in hazard normalization. Annual days or nights are split by a severe seasonal-burden anchor for the two heat indicators. Only the increase above the historical value is scaled for the largest 5 day precipitation. The ratio of the event-frequency to the historical frequency is scaled for the return-period indicator. In the stress test, each anchor is varied since there is no universal cross-hazard normalization benchmark. The central values are the reproductions of a meaningful screening scale, and the lower and higher anchors check whether the ranking is dependent upon this choice.
Table 3. Hazard normalization rules and benchmark uncertainty
| Indicator | Normalized burden H | Central benchmark | Benchmarks stress-tested | Interpretation |
|---|---|---|---|---|
| Heat-index days >35 C | min(x / B_heat, 1) | 180 days | 150, 180, 210 days | Half-year exposure is a scaling anchor, not a physiological threshold. |
| Tropical nights >26 C | min(x / B_heat, 1) | 180 nights | 150, 180, 210 nights | Same seasonal-burden scaling as high heat days. |
| Largest 5-day precipitation | clip[(x - x0) / B_p, 0, 1] | 100 mm increase | 75, 100, 125 mm | Scales the positive change above the historical/reference value. |
| Historical 100-year event frequency | clip[(100/T - 1) / B_f, 0, 1] | B_f = 2.0 | 1.5, 2.0, 2.5 | Central anchor maps a threefold frequency ratio to H = 1. |
Note. clip[z, 0, 1] truncates values below 0 to 0 and values above 1 to 1. The benchmarks are transparent normalization choices and are therefore included in sensitivity analysis rather than treated as empirical constants.
Screening score U = 100 x H x C
3.5 Deep-uncertainty stress test and robustness metric
The primary stress test for each hazard crosses 4 uncertainty dimensions: three climate values (lower ensemble value, median, upper ensemble value), three vulnerability values, three readiness values and three normalization benchmarks. A full factorial design with 3 x 3 x 3 x 3 = 81 combinations for each hazard is used. All combinations are equally weighted since this is a stress test rather than a forecasting exercise about the future concurrent states. A robustness fraction should therefore not be interpreted as a probability that the action is optimal or needs to be taken.
Robustness in this case is the percentage of stress-test combinations with a screening score at or above t.
Robustness_i(t) = (1 / 81) x sum_s I[ U_i,s >= t ]
The main screening threshold is 40. Sensitivity is evaluated at thresholds 20, 30, 40, 50, and 60. In addition, a fixed normalization check is reported, based on the central benchmark only. That check has 27 combinations per hazard and shows if the expanded benchmark uncertainty "materially" affects the ranking.
3.6 Empirical workflow and reproducibility
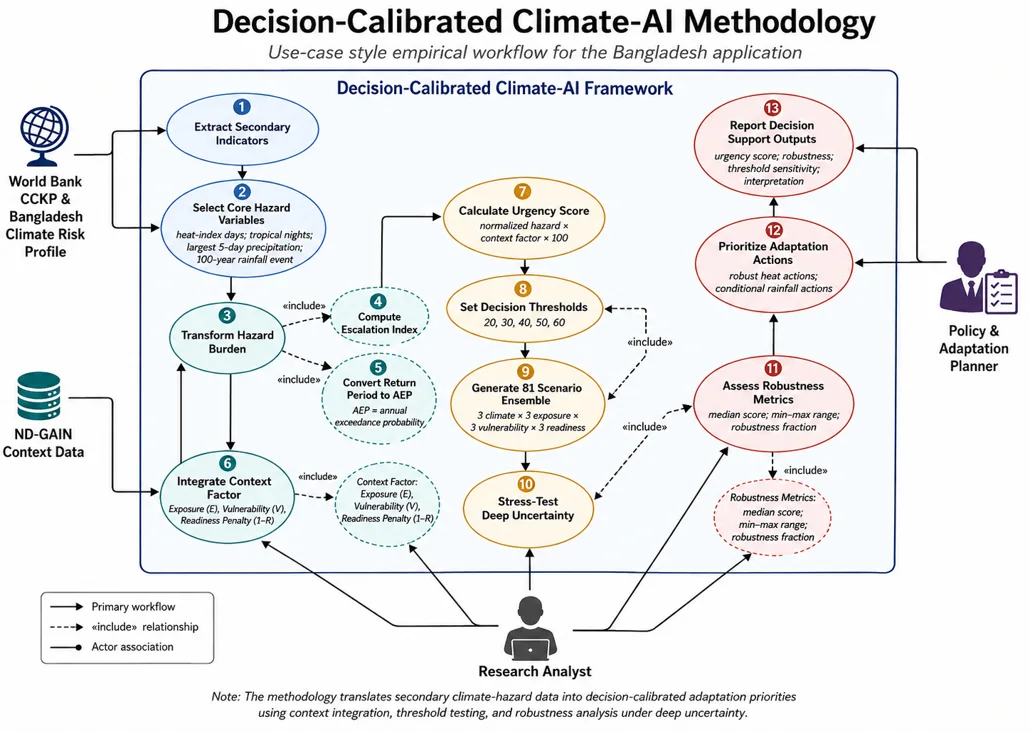
Figure 2 summarizes the empirical procedure. Published values are first extracted and checked for consistent reference periods and scenario definitions. Hazard escalation is then calculated. Context and hazard normalization are kept separate before being combined into the screening score. The full factorial stress test generates robustness fractions and threshold-sensitivity curves. All reported derived values can be reconstructed from Tables 3 and 4; no missing-value imputation, geospatial interpolation, or synthetic observation generation is used.
| A. Extract documented values Historical/reference and 2040-2059 SSP3-7.0 values plus lower/median/upper ensemble information | |
|---|---|
| ↓ | |
| B. Build descriptive hazard metrics Escalation index and event-frequency compression | |
| ↓ | |
| C. Calculate transparent screening score Hazard normalization x vulnerability/readiness context factor; exposure reported separately | |
| ↓ | |
| D. Run 81-combination stress test Climate quantile x vulnerability x readiness x normalization benchmark | |
| ↓ | |
| E. Evaluate robustness Threshold crossing at t = 40 plus sensitivity at 20, 30, 50, and 60 | |
| ↓ | |
| F. Translate to decision class Immediate low-regret attention | conditional pathway | additional local evidence required |
Figure 2. Empirical workflow for the Bangladesh demonstration
Note. The workflow is reproducible from the published aggregate values. In an operational climate-AI implementation, raw forecast probabilities would additionally be subjected to out-of-sample skill and calibration tests before Step C.
3.7 Statistical interpretation and claims boundary
The analysis is deterministic conditional on the inputs used in the stress-test. No p-values, confidence intervals, causal estimates or predictive out-of-sample performance statistics are provided as the analytical sample is not a random sample of observations. The ranges in the ensemble are the climate-model uncertainty information and used as scenario values while the socioeconomic perturbations and normalization ranges are analyst-defined sensitivity ranges. This is reflected in the results throughout the distinction. The adjective 'robust' refers to the fact that the threshold crossing is stable for the defined stress-test combinations, not statistically significant, causally effective or optimal in a welfare-economic sense.
4. Results
4.1 Mid-century hazard escalation
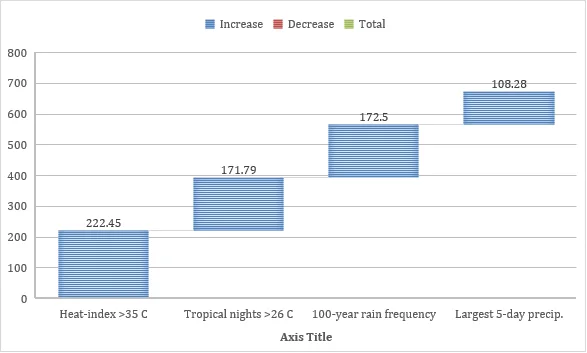
Documented inputs and derived central estimates are shown in table 4. The increasing number of heat-index days that exceed 35 C is from approximately 60 days annually in the historical/reference period to 133.47 days annually in the SSP3-7.0 median in 2040-2059 with an ensemble range of 85.88-172.12 days. The escalation index is thus 222.45 and the median count exceeds the approximate historical burden by more than a factor of two. The number of tropical nights increases from 77.53 nights/year to 133.19, an escalation index of 171.79. Taken together, these two are suggestive of significant elongation of daytime and nighttime heat stress.
The rainfall indicators have a different structure. Average largest five-day precipitation rises from 301.28 mm to 326.24 mm at the median, an escalation index of 108.28. However, the ensemble range of 219.38-473.81 mm is wide, so the median masks substantial upper-tail change. The historical 100-year one-day rainfall event is projected to have a median future return period of 57.97 years. Its annual frequency is therefore approximately 1.725 times the historical frequency, represented by an escalation index of 172.50. The published range, 19.48-195.85 years, includes both strong frequency compression and a lower-frequency outcome.
Table 4. Key inputs and central derived indicators
| Indicator | Historical / reference | 2040-2059 SSP3-7.0 median | Published range | Escalation index | Median screening score |
|---|---|---|---|---|---|
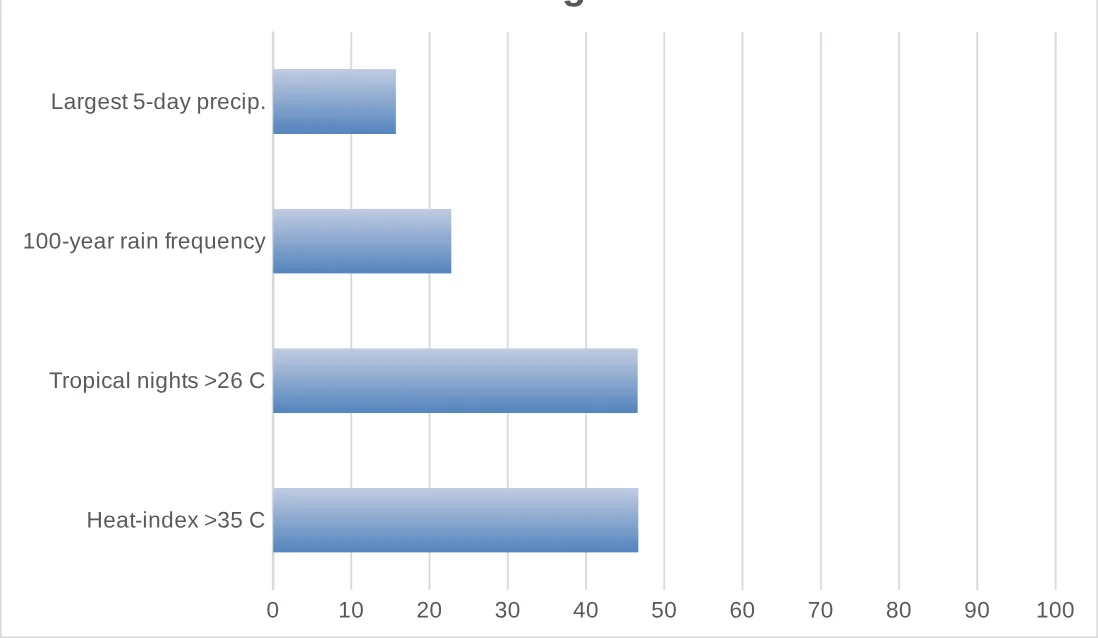
| Heat-index days >35 C | ~60 days/year | 133.47 days/year | 85.88-172.12 | 222.45 | 46.7 |
| Tropical nights >26 C | 77.53 nights/year | 133.19 nights/year | 92.81-166.30 | 171.79 | 46.6 |
| Largest 5-day precipitation | 301.28 mm | 326.24 mm | 219.38-473.81 | 108.28 | 15.7 |
| Historical 100-year 1-day rainfall event | 100-year return period | 57.97-year return period | 19.48-195.85 years | 172.50 | 22.8 |
| Population exposure context | Not applicable | 56% in high climate-exposure areas | >90 million people | Not scored | Reported separately |
| ND-GAIN context | Not applicable | V = 0.544; R = 0.284 | Stress: V +/-0.05; R +/-0.05 | Not applicable | C = 0.630 |
Note. Climate values and exposure context are from the World Bank Bangladesh Climate Risk Country Profile; vulnerability and readiness are from ND-GAIN. The screening score uses the central normalization benchmark and central context factor. Exposure is not numerically combined with ND-GAIN vulnerability to avoid double counting.
Note. Historical/reference conditions are indexed to 100. The return-period indicator is expressed as the ratio of future to historical event frequency.
4.2 Hazard magnitude and context-adjusted screening
The baseline median context-adjusted screening scores are 46.7 for heat-index days and 46.6 for tropical nights. The historical 100-year rainfall-frequency indicator is 22.8 and largest five-day precipitation is 15.7. These values are not estimates of damage, but outputs of the transparent screening. They are derived from different hazard specific normalization rules and thus are most useful to test a stable priority to alternative assumptions, not to claim that heat and rainfall are cardinally equivalent.
Increased exposure context is an underlying material that enhances the policy relevance of the heat without being incorporated into the score: over half of the national population is reported to reside in high climate-exposure areas and the heat indicators are based on repeated annual exposure on many days and nights. The rainfall indicators, on the other hand, are more tail-dependent. The median 5-day precipitation change is small but at the high end values a very different decision signal can be derived. This distinction is the main reason for having a median point estimate and a scenario robustness in the framework.
Note. Scores use C = 0.630 and the central normalization benchmarks in Table 3. They are screening indices, not probabilities, monetary losses, or causal effects.
4.3 Robustness across 81 stress-test combinations
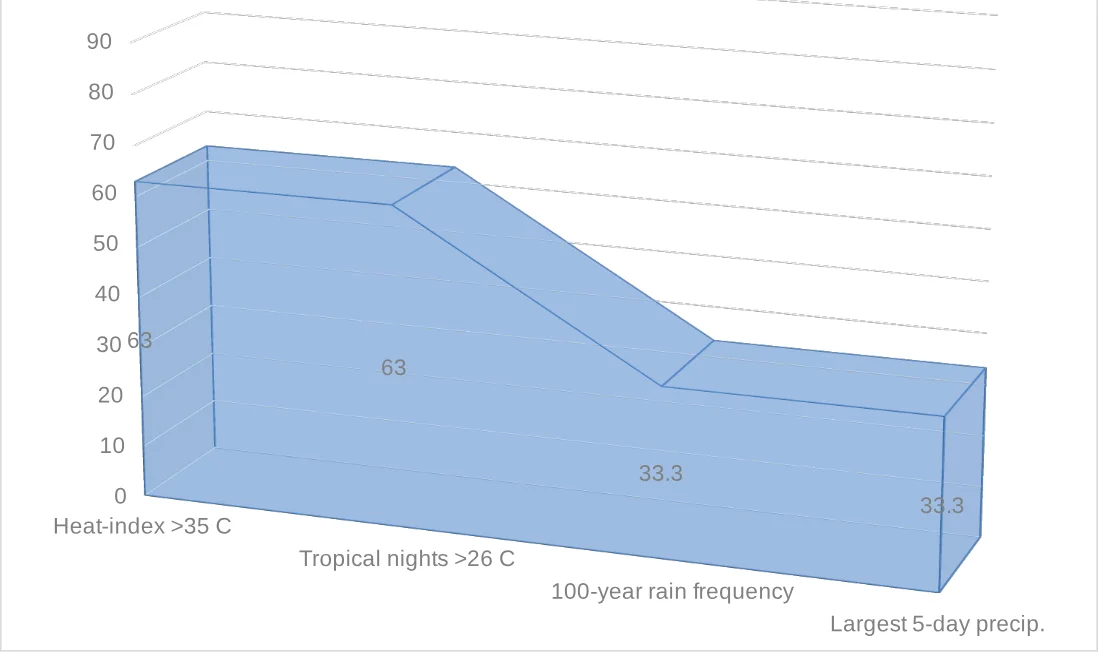
The main threshold used (40) is exceeded by the number of heat-index days and tropical nights in 63.0% of the 81 stress-test combinations. There are 33.3% of the combinations where each rainfall indicator reaches the threshold. The corresponding heat robustness is 66.7% with the normalization benchmarks set at their central value and the rainfall values set at 33.3%. Normalisation uncertainty is thus added on heat, slightly reducing its apparent robustness, but the main ranking is not affected, at the threshold of 40.
The scenario ranges also demonstrate that the rainfall indicators are by no means insignificant. The heat-index screening score varies from 23.7 to 68.0 and the tropical-night score from 25.6 to 68.0. Both rainfall indicators are in the range 0 to 68.0 since low-end climate values yield no positive burden whereas values in the upper tail of the distribution are clipping at 68.0. The differentiated correct interpretation is thus that heat sticks around more in the defined assumptions whereas heavy rainfall has a stronger tail dependence so that it can be equally urgent under adverse combinations.
The structure of the rainfall indicators is different. The median increase in the largest five-day precipitation is from 301.28 mm to 326.24 mm (escalation index of 108.28). The ensemble range, however, is large (219.38-473.81 mm) and the median obscures a significant change in the upper tail. The historical 100 year ODR event is expected to become a median 57.97 year ODR event in the future. This means that its frequency is about 1.725 times the historical frequency with an escalation index of 172.50. The published range of 19.48-195.85 years evidences strong compression of the frequencies, as well as a lower-frequency result.
Table 5. Robustness summary for the selected hazard-linked screening priorities
| Hazard-linked priority | Median score | Minimum | Maximum | Robustness at t >= 40 | Interpretation |
|---|---|---|---|---|---|
| Heat-index days >35 C | 46.7 | 23.7 | 68.0 | 63.0% | Consistently elevated; supports low-regret heat-health and occupational protection. |
| Tropical nights >26 C | 46.6 | 25.6 | 68.0 | 63.0% | Consistently elevated; supports cooling access, housing, and health surveillance. |
| Historical 100-year rainfall event frequency | 22.8 | 0.0 | 68.0 | 33.3% | Tail-dependent; supports triggers, flood preparedness, and scalable contingency capacity. |
| Largest 5-day precipitation | 15.7 | 0.0 | 68.0 | 33.3% | Median signal is limited, but upper-tail combinations justify flexible drainage and flood planning. |
Note. Robustness is the share of 81 equally weighted stress-test combinations crossing the screening threshold. It is not a probability that the hazard will occur or that an adaptation option is economically optimal.
Note. Values are based on the expanded stress test that includes climate, vulnerability, readiness, and normalization-benchmark uncertainty.
4.4 Threshold sensitivity and ranking reversals
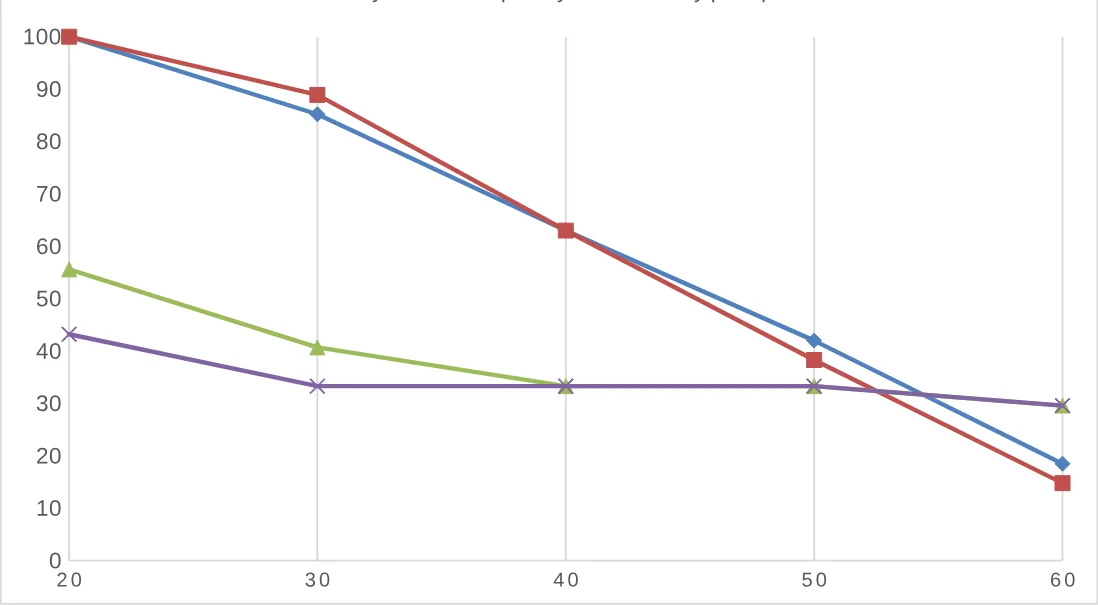
Threshold sensitivity is the most powerful argument to not interpret a single score. Both heat indicators reach the threshold at t = 20 in 100% of combinations while rainfall-event frequency and five-day precipitation do so in 55.6% and 43.2% of combinations, respectively. Tropical nights are at 88.9% at t = 30, 85.2% for heat-index days and 40.7% for rainfall-frequency and 33.3% for five-day precipitation. Both the heat indicators are still in the 63.0% and rainfall indicators are still in the 33.3% at t = 40. The difference decreases at t = 50, to 42.0% for heat-index days, 38.3% for tropical nights and 33.3% for each rainfall indicator.
For the most stringent level (t = 60), the ordering is inverted, with each rainfall indicator exceeding the other 29.6% of the time, vs. 18.5% for heat-index days and 14.8% for tropical nights. This is because the upper-tail rain scenarios cover the top end of the normalized burden range whereas heat is spread out over a fuller range of the normalized burden. The outcome is really useful. Heat may be the more persistent cross-scenario problem; but rainfall can be the larger dominant factor of a decision rule focused on very extreme tail conditions. The dependence should be revealed in a decision calibrated system, and not concealed in one preferred threshold.
Note. The lines report the percentage of 81 stress-test combinations that meet or exceed each screening threshold. The rainfall indicators overtake the heat indicators at the strict threshold of 60, illustrating tail-risk sensitivity.
5. Discussion
5.1 What the results establish - and what they do not
The technique is more important than the predictions. Heat gives a more robust mid century screening signal within the uncertainty dimensions of the four indicators while rainfall indicators are more sensitive to the high tail climate conditions and the level of the decision threshold. This is not an indication of the categorical scale of heat as the biggest climate risk in Bangladesh. Cyclone, riverine flooding, coastal flooding, sea level rise, salinity, drought and compound events are not included in the empirical comparison. It also doesn't make comparisons of the cost-effectiveness of adaptation projects. A less fragile defensible conclusion is that for these specific indicators, and this clear national screening design, the attention to heat is less sensitive to the assumptions tested, and the attention to heavy rainfall remains with good tail-risk triggers.
This more limited interpretation goes a long way to enhancing the credibility of the framework. In many cases, national climate-risk studies are under pressure to transform a diverse list of hazards into a ranked list of hazards. These rankings may hide variations in the physical units, time scales, and consequence functions. The DCCA approach views the score, rather, as an audit tool: it identifies what assumptions must be made to achieve a threshold, if the ranking differs, and what local data is most useful. The threshold switch is at 60 which is a benefit. It is possible that a purely median story would buy you some tail protection on the precipitation side, and a purely tail-only story would buy you some tail protection on the heat side, but the annual heat burden would be understated.
5.2 Implications for climate-AI evaluation
The paper also helps to clear up the AI role. Recent literature in AI weather models offer strong evidence that AI can aid in improving the skill of weather forecasts and that in probabilistic weather systems like GenCast, forecast distributions can be accurately represented by AI systems (Price et al., 2025).However, there is still more to be done before adaptation governance is established. Firstly, the model needs to be validated on a valid benchmark. Second, the probabilistic output has to be calibrated at the event threshold, lead time, season and spatial scale pertinent to the decision. Third, the decision thresholds and the effects of wrong decisions have to be determined. Fourthly, the results should be translated in the light of vulnerability, preparedness and exposure. Fifth, the action produced should be stress-tested to assure its durability. Some of these steps can be omitted, which can lead to deceptive precision in the computational sophistication.
This argument is supported by (Mehryar et al., 2024), who conclude that there is a disconnect between AI-driven climate risk assessments and the resilience, prioritisation and implementation governance processes. It also resonates with the practitioner-centered findings of (Neset et al., 2024), that AI-assisted weather alerts rely on organisational procedures and contextual expertise. The part of DCCA is formalizing these insights in the form of an auditable sequence and linking these to forecast-calibration and DMDU concepts. It thus does not render AI a substitute for climate-risk governance. AI provides information, decisions are made under uncertainty in the institutions.
5.3 Relation to adaptation decision analysis and DMDU
The robustness analysis complements rather than replaces full adaptation decision analysis. (Amanuma et al., 2024)show that decision-analysis methods in adaptation remain unevenly distributed across sectors and that approaches capable of addressing deep uncertainty represent a minority of reviewed applications. (Babich Morrow et al., 2025) further show that adaptation decisions can be highly sensitive to uncertain decision attributes. The present screening design makes this sensitivity visible earlier in the evidence chain by including not only climate uncertainty but also context and normalization choices.
The implication is practical. A screening result should determine what kind of next analysis is warranted. A consistently elevated heat signal can justify low-regret actions that have benefits across many scenarios, such as heat-health warning protocols, worker protection, shaded public space, and improved cooling access, while more capital-intensive interventions should still undergo local appraisal. A tail-dependent rainfall signal suggests adaptive pathways: maintain drainage, early warning, emergency preparedness, and flexible finance now, while linking larger investments to observed drainage performance, updated subnational projections, settlement growth, and agreed trigger points. This staged logic is consistent with dynamic adaptive policy pathways (Haasnoot et al., 2013)
5.4 Bangladesh interpretation and external evidence
The heat result is in line with the general evidence in Bangladesh. The World Bank heat study presents large magnitude increases in maximum and apparent temperature, and details relationships between exposure to heat and physical and mental health outcomes as well as productivity losses (Mahmud et al., 2024)Recent projection studies based on the latest climate model simulations (CMIP6) also predict robust warming signals in Bangladesh, with spatial variations in the regional patterns and responses in precipitation depending on the model and the climate scenarios (Jihan et al., 2025; Kamruzzaman et al., 2023).These studies echo two aspects of the DCCA interpretation: heat is one of the development stressors that occurs across all sectors on a regular basis, and national averages do not replace subnational analysis.
It is important to read the result of the rainfall in the same manner. River processes, upstream processes, land use and drainage, tidal, cyclone, national settlement and settlement pattern are the factors that influence the flood risk in Bangladesh, and one single national precipitation indicator cannot capture all these mechanisms within a five day window. Despite the broad climate envelope and short return period for high-end scenarios, however, this indicates that the high-end scenarios should still be kept in infrastructure and contingency planning. That is, reduced robustness at a moderate cut-off doesn't mean reduced priority of flood resilience. It is a justification to have decision rules based on triggers or locations, and not only from the national median alone.
6. Policy and Governance Implications
The DCCA framework puts forward a minimum reporting requirement for public sector use of climate AI. Climate-service providers should provide information on the source of the forecast, performance benchmarking, uncertainty, and probabilistic calibration, if applicable. Decision users should then record what threshold triggers a change of action, the costs of a false alarm and failure to act, the extent of exposure and vulnerability, the ability to implement action, and assumptions made in translating hazard information into a decision. Finally, robust priorities should include a sensitivity analysis with results indicating where the priority changes.
The chosen indicators for Bangladesh are in support of a twofold strategy. The need for heat-related measures should be addressed now with low-regrets, since the heat signal is still high for most moderate thresholds and stress-test combinations. Potential spaces for assessment include heat-health action plans, occupational heat standards, school and workplace plans, UGI, cooling access for vulnerable populations, and granular heat-health surveillance. Heavy-rainfall adaptation should involve ongoing low-regret maintenance and preparedness actions and be conditional on scaling up major capital works. The investment in drainage, flood-resilient infrastructure, emergency finance and warning systems should be linked to subnational tail-risk evidence and explicit triggers.
The same logic can be applied in adaptation-finance institutions. The AI generated hazard map or high resolution forecast may not be investment ready by itself. There are 4 further items that may be required in Project appraisal: Calibration or Verification Evidence, Non-Duplicative Vulnerability/Exposure Assessment, Threshold /Consequence Justifications, Robustness to Plausible Climate /Decision Assumptions. These requirements would help to limit the possibility of confusing visually convincing AI results with full evidence and render different adaptation proposals more comparable and subject of audit.
7. Limitations and Future Research
The study has a number of limitations which establish its limits. To begin with, the empirical application is national and it employs published national indicators. It cannot account for district, city, watershed, occupational or household differences. Second, it is not a tool that builds an AI model or empirically works out the forecast calibration from forecasts and observations. The AI contribution is a decision-governance framework that is compatible with the AI outputs, it is not an AI-performance experiment. Thirdly, just four hazard indicators are compared, thus the analysis is not a complete ranking of hazards for Bangladesh. Fourth, screening score is based on transparent but normative normalization anchors and even weighting of vulnerability and readiness penalty. Stress testing of Benchmark uncertainty, with locally validated weighting structure. Fifth, ND-GAIN is a country-level index, so it cannot capture the variation in institutions or socioeconomics within countries. Sixth, the adaptation costs, distributional preferences, feasibility and stakeholder defined loss functions are not observed and no claim is made for economically optimal adaptation.
Future study should test the framework with the raw gridded CCKP, ERA5, CMIP6 or operational AI-weather outputs and test spatial and temporal holdouts for validation. Proper scoring rules and threshold-specific reliability diagnostics are needed to assess probabilistic forecasts prior to the decision layer. Exposure and vulnerability should be determined and geocoded at the level of implementation and should be equal to simple aggregation of indices whenever it is overlapping constructs, should be treated explicitly in terms of measurement model. The next analytical step should also be an evaluation of concrete adaptation options by cost, benefit, equity, feasibility and regret. Different levels of acceptable error exist for health, labour, agriculture, housing, transport, and flood management and this would help to calibrate decisionmaking using thresholds elicited by stakeholders. Lastly, scenario discovery could help identify the conditions - in terms of climate and/or institutions - under which a desired adaptation pathway is not possible, transforming the current screening framework to a more dynamic trigger system.
8. Conclusion
In this paper, a decision-calibrated climate-AI framework is developed that distinguishes forecast information from adaptation choice, and illustrates the use of the decision layer with published climate-risk indicators for Bangladesh. The framework separates predictive skill, probabilistic calibration, decision calibration and decision robustness. It also addresses two common false precision pitfalls: double counting exposures and vulnerabilities, and assuming that normalization decisions are set in stone rather than assumptions to be stress-tested.
Among the four indicators, the most persistent screening signals by their four value combinations above moderate thresholds are that of heat-index days above 35 C (63.0% of the expanded 81-combination stress test) and tropical nights (63.0% of the expanded 81-combination stress test). The selected rainfall indicators intersect in 33.3%, but the upper-tail combinations of rainfall indicators outpass the heat indicators at a rigorous threshold of 60. This is not a straightforward hazard classification policy message. Immediate low-regret attention is needed in the face of heat, whereas strong tail-risk triggers and adaptive pathways are needed to heavy rainfall. Climate AI more generally is a decision-support input that needs to be governed as such. Users of forecast outputs should be aware of the reliability of the model, how the threshold was selected, how vulnerability and capacity may have been represented and whether the decision holds up to plausible uncertainty.
Ethics Statement
The study uses publicly available aggregate secondary data and does not involve recruitment of human participants, private personal data, intervention, or human-subject experimentation. Human-subject ethics approval was therefore not required for this analysis.
Funding
No external funding is declared in the supplied manuscript.
Conflict of Interest
The supplied manuscript declares no conflict of interest.
Author Contributions
Author-identifying contribution information is omitted from this blinded manuscript. It should be supplied in the journal submission system or a separate title page according to the target journal's policy.
References
- Ahmad, R., Hasan, M. K., & Jahan, C. S. (2025). Characterization of heatwave pattern and its long-run predictions using CMIP6 model in western and north-western climatic zones of Bangladesh. *Environmental Science and Pollution Research, 32*(13), 8378–8397. https://doi.org/10.1007/s11356-025-36209-6
- Amanuma, E., Fujii, M., Nakajima, K., & Hijioka, Y. (2024). Decision analysis for prioritizing climate change adaptation options: A systematic review. *Environmental Research Letters, 19*(8), 083004. https://doi.org/10.1088/1748-9326/ad61fe
- Babich Morrow, C., Dawkins, L., Pianosi, F., Prangle, D., & Bernie, D. (2025). From climate risk to action: Analysing adaptation decision robustness under uncertainty. *Climate Risk Management, 50*, 100751. https://doi.org/10.1016/j.crm.2025.100751
- Bi, K., Xie, L., Zhang, H., Chen, X., Gu, X., & Tian, Q. (2023). Accurate medium-range global weather forecasting with 3D neural networks. *Nature, 619*, 533–538. https://doi.org/10.1038/s41586-023-06185-3
- Eyring, V., Bony, S., Meehl, G. A., Senior, C. A., Stevens, B., Stouffer, R. J., & Taylor, K. E. (2016). Overview of the Coupled Model Intercomparison Project Phase 6 (CMIP6) experimental design and organization. *Geoscientific Model Development, 9*, 1937–1958. https://doi.org/10.5194/gmd-9-1937-2016
- Gneiting, T., & Raftery, A. E. (2007). Strictly proper scoring rules, prediction, and estimation. *Journal of the American Statistical Association, 102*(477), 359–378. https://doi.org/10.1198/016214506000001437
- Haasnoot, M., Kwakkel, J. H., Walker, W. E., & ter Maat, J. (2013). Dynamic adaptive policy pathways: A method for crafting robust decisions for a deeply uncertain world. *Global Environmental Change, 23*(2), 485–498. https://doi.org/10.1016/j.gloenvcha.2012.12.006 IPCC. (2022). *Climate change 2022: Impacts, adaptation and vulnerability*. Cambridge University Press. https://doi.org/10.1017/9781009325844
- Jihan, M. A. T., Popy, S., Kayes, S., Rasul, G., Maowa, A. S., & Rahman, M. M. (2025). Climate change scenario in Bangladesh: Historical data analysis and future projection based on CMIP6 model. *Scientific Reports, 15*, 7856. https://doi.org/10.1038/s41598-024-81250-z
- Kalra, N., Hallegatte, S., Lempert, R., Brown, C., Fozzard, A., Gill, S., & Shah, A. (2014). *Agreeing on robust decisions: New processes for decision making under deep uncertainty*. World Bank. https://openknowledge.worldbank.org/handle/10986/18772
- Kamruzzaman, M., Wahid, S., Shahid, S., Alam, E., Mainuddin, M., Islam, H. M. T., Cho, J., Rahman, M. M., Biswas, J. C., & Thorp, K. R. (2023). Predicted changes in future precipitation and air temperature across Bangladesh using CMIP6 GCMs. *Heliyon, 9*(5), e16274. https://doi.org/10.1016/j.heliyon.2023.e16274
- Kwakkel, J. H., Haasnoot, M., & Walker, W. E. (2016). Coping with the wickedness of public policy problems: Approaches for decision making under deep uncertainty. *Journal of Water Resources Planning and Management, 142*(3), 01816001. https://doi.org/10.1061/(ASCE)WR.1943-5452.0000626
- Lam, R., Sanchez-Gonzalez, A., Willson, M., Wirnsberger, P., Fortunato, M., Alet, F., Ravuri, S., Ewalds, T., Eaton-Rosen, Z., Hu, W., Merose, A., Hoyer, S., Holland, G., Vinyals, O., Stott, J., Pritzel, A., Mohamed, S., & Battaglia, P. (2023). Learning skillful medium-range global weather forecasting. *Science, 382*(6677), 1416–1421. https://doi.org/10.1126/science.adi2336
- Lempert, R. J., & Groves, D. G. (2010). Identifying and evaluating robust adaptive policy responses to climate change for water management agencies in the American West. *Technological Forecasting and Social Change, 77*(6), 960–974. https://doi.org/10.1016/j.techfore.2010.04.007
- Lempert, R. J., Lawrence, J., Kopp, R. E., Haasnoot, M., Reisinger, A., Grubb, M., & Pasqualino, R. (2024). The use of decision making under deep uncertainty in the IPCC. *Frontiers in Climate, 6*, 1380054. https://doi.org/10.3389/fclim.2024.1380054
- Mahmud, I., Raza, W. A., & Wahid, S. S. (2024). *An unsustainable life: The impact of heat on health and the economy of Bangladesh*. World Bank. https://doi.org/10.1596/978-1-4648-2172-1 Marchau, V. A. W. J., Walker, W. E., Bloemen, P. J. T. M., & Popper, S. W. (Eds.). (2019). *Decision making under deep uncertainty: From theory to practice*. Springer. https://doi.org/10.1007/978-3-030-05252-2
- Mehryar, S., Yazdanpanah, V., & Tong, J. (2024). AI and climate resilience governance. *iScience, 27*(6), 109812. https://doi.org/10.1016/j.isci.2024.109812 Neset, T.-S., Vrotsou, K., Andersson, L., Navarra, C., Schuck, F., Edstrom, M. M., Rydholm, C., Villaro, C. G., Kucher, K., & Linner, B.-O. (2024). Artificial intelligence in support of weather warnings and climate adaptation. *Climate Risk Management, 46*, 100673. https://doi.org/10.1016/j.crm.2024.100673 Notre Dame Global Adaptation Initiative. (n.d.). *ND-GAIN Country Index: Bangladesh*. University of Notre Dame. Retrieved September 1, 2026, from https://gain-new.crc.nd.edu/country/bangladesh
- Price, I., Sanchez-Gonzalez, A., Alet, F., Andersson, T. R., El-Kadi, A., Masters, D., Ewalds, T., Stott, J., Mohamed, S., Battaglia, P., Lam, R., & Willson, M. (2025). Probabilistic weather forecasting with machine learning. *Nature, 637*, 84–90. https://doi.org/10.1038/s41586-024-08252-9
- Rasp, S., Dueben, P. D., Scher, S., Weyn, J. A., Mouatadid, S., & Thuerey, N. (2020). WeatherBench: A benchmark data set for data-driven weather forecasting. *Journal of Advances in Modeling Earth Systems, 12*(11), e2020MS002203. https://doi.org/10.1029/2020MS002203
- Zhang, Y., Long, M., Chen, K., Xing, L., Jin, R., Jordan, M. I., & Wang, J. (2023). Skilful nowcasting of extreme precipitation with NowcastNet. *Nature, 619*, 526–532. https://doi.org/10.1038/s41586-023-06184-4 World Bank. (n.d.-b). *Climate Change Knowledge Portal: Projected climate data, CMIP6 0.25-degree*. World Bank Data Catalog. Retrieved September 1, 2026, from https://datacatalog.worldbank.org/infrastructure-data/search/dataset/0042297/climate-change-knowledge-portal-projected-climate-data-cmip6-0-25-degree World Bank Group. (2024). *Climate risk country profile: Bangladesh*. https://climateknowledgeportal.worldbank.org/sites/default/files/country-profiles/16813-WB_Bangladesh%20Country%20Profile-WEB.pdf Notre Dame Global Adaptation Initiative. (n.d.). *ND-GAIN Country Index: Bangladesh*. University of Notre Dame. Retrieved September 1, 2026, from https://gain-new.crc.nd.edu/country/bangladesh
CITE THIS ARTICLE
Afrin, S. (2026). Decision-Calibrated Climate AI: Translating Hazard Information into Robust Adaptation Priorities under Deep Uncertainty - A Bangladesh Demonstration. https://www.researchbysadia.com/article/effeed66-4dab-4d7d-ad4c-e205adbe1d97
S. Afrin, “Decision-Calibrated Climate AI: Translating Hazard Information into Robust Adaptation Priorities under Deep Uncertainty - A Bangladesh Demonstration,” 2026. [Online]. Available: https://www.researchbysadia.com/article/effeed66-4dab-4d7d-ad4c-e205adbe1d97
Afrin, S. (2026) ‘Decision-Calibrated Climate AI: Translating Hazard Information into Robust Adaptation Priorities under Deep Uncertainty - A Bangladesh Demonstration’. Available at: https://www.researchbysadia.com/article/effeed66-4dab-4d7d-ad4c-e205adbe1d97
Afrin, Sadia. “Decision-Calibrated Climate AI: Translating Hazard Information into Robust Adaptation Priorities under Deep Uncertainty - A Bangladesh Demonstration.” 2026, https://www.researchbysadia.com/article/effeed66-4dab-4d7d-ad4c-e205adbe1d97.
Sadia Afrin. “Decision-Calibrated Climate AI: Translating Hazard Information into Robust Adaptation Priorities under Deep Uncertainty - A Bangladesh Demonstration.” (2026). https://www.researchbysadia.com/article/effeed66-4dab-4d7d-ad4c-e205adbe1d97.
Afrin S. Decision-Calibrated Climate AI: Translating Hazard Information into Robust Adaptation Priorities under Deep Uncertainty - A Bangladesh Demonstration. 2026. https://www.researchbysadia.com/article/effeed66-4dab-4d7d-ad4c-e205adbe1d97
@misc{article_effeed664dab4d7dad4ce205adbe1d97,
  title = {Decision-Calibrated Climate AI: Translating Hazard Information into Robust Adaptation Priorities under Deep Uncertainty - A Bangladesh Demonstration},
  author = {Sadia Afrin},
  year = {2026},
  url = {https://www.researchbysadia.com/article/effeed66-4dab-4d7d-ad4c-e205adbe1d97},
}
TY - GEN AU - Sadia Afrin TI - Decision-Calibrated Climate AI: Translating Hazard Information into Robust Adaptation Priorities under Deep Uncertainty - A Bangladesh Demonstration PY - 2026 UR - https://www.researchbysadia.com/article/effeed66-4dab-4d7d-ad4c-e205adbe1d97 ER -